
Internal Load Monitoring (sRPE)
Monitoring training load is essential to help coaches manage an athlete’s training and recovery, and it can identify potential drop-offs in performance and heightened risk of injury.
With RYPT, you can monitor your clients'/athletes' internal training loads using the sRPE method and the validated Modified Borg Scale CR-10 scale to measure their rate of perceived exertion. Internal load is the athlete’s physiological, psychological, and perceptual response to the external load. It is influenced by a host of other factors unique to each individual athlete, such as their fitness level, fatigue, and other lifestyle factors.
sRPE or Session-RPE method is a simple, scientifically validated method developed by Dr. Carl Foster. It combines both objective and subjective data by asking the athlete to record the duration of their session in minutes and to rate the session difficulty on the 10-point scale. These numbers are multiplied to calculate the sRPE or Load for that session.
Capturing Data
Scheduled Sessions
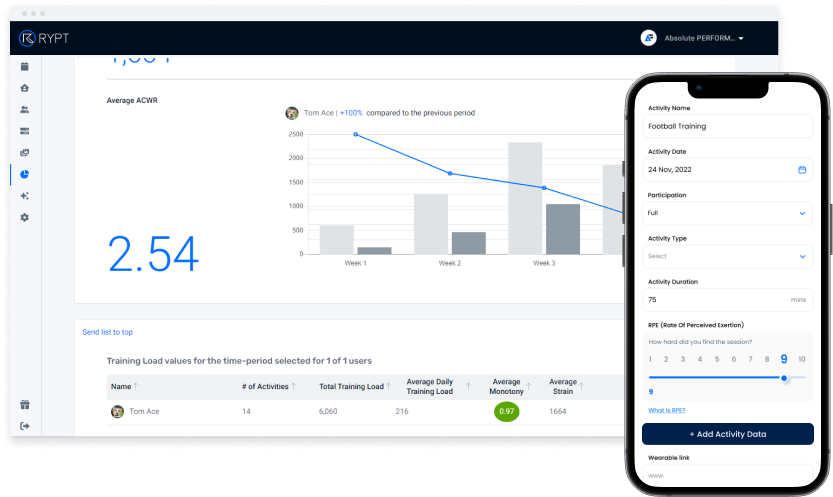
When your clients/athletes complete one of the sessions you scheduled for them, they're asked to submit their RPE data for the session as shown below. As well as entering the session duration in minutes, and the Rate of Perceived Exertion, they can also add:
- Participation / if they didn't take full part in the session for some reason they have the option to set their participation to Injured, Modified, or Return-to-Play. This allows you to filter their data out of the group averages so they're not skewed.
- A Wearable Link / if they were using a wearable like a heart rate monitor or GPS device during the session and they want to share a link to their session data with you; and,
- Notes / if they want to give you any feedback on the session or share anything else like injuries they may have picked up etc.
Other Activities
If your clients/athletes are doing other sessions outside of the ones you've scheduled for them, they can also create activities in the RYPT app and submit their RPE data. This is very helpful when working with youth athletes who might be involved in multiple sports, or when you're working with clients/athletes that are involved in sports outside of your coaching, or just do extra sessions from time to time, as it gives you the full picture of their workload to help you manage them more effectively.
Similar to a scheduled activity they can also add additional information for you like wearable links and notes, and they can also set the Activity Type and add GPS data if they used a device to track their session.
This video gives you a quick demo of how simple it is for your clients/athletes to create activities in the RYPT app.
Video length: 2 mins 04 secs
Interpreting the Data
Calendar
Flags to highlight important data
Your day-to-day monitoring can be done from the calendar which will be populated with all of your clients'/athletes' data as they submit it. Flags in the calendar will highlight when someone has submitted a very high RPE for a session or if the session duration was longer than intended, so you quickly know where you may need to dig a little deeper. If a particular individual is an outlier, their load may need to be increased or decreased.

Viewing session averages
Each individual's RPE data will be displayed in the sidebar of the group calendar view where you can also view the average RPE for a group session to ensure that the session difficulty was what you intended. If the session average is higher or lower than intended, it may indicate that your training plan may not have the desired outcome and may need to be adjusted.

Analysis Training Load Dashboard
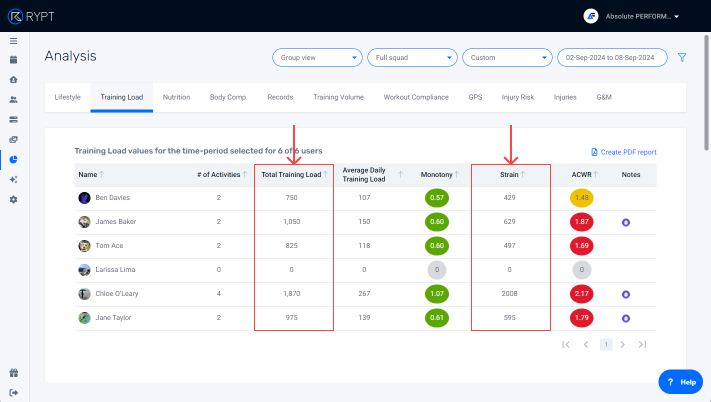
A deeper analysis of your RPE data can be done in the Training Load Dashboard in the Analysis section. Here you can you can analyze group averages or individual client/athlete data.
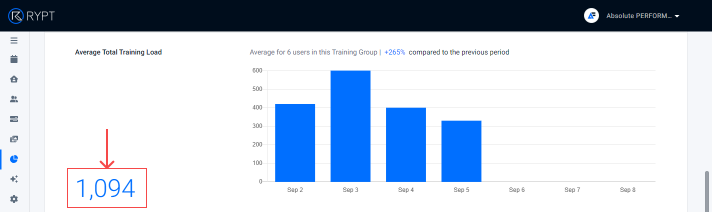
Track weekly load
Tracking weekly load is important to ensure that your clients/athletes are exposed to appropriate loads for the current training phase. It can also be used to determine whether the training matches your planned loads and identify whether the plan needs to be adjusted either for an individual or for the entire group.
The training load dashboard provides you with each individual's Total Training Load and Strain (Total Training Load x Monotony), as well as the group average for these metrics.
Identify spikes in load
Spikes in workload can increase an individual's risk of injury so it's important to monitor weekly training load to ensure that it is increased gradually. This is particularly useful when a client/athlete is returning from injury or a long period of inactivity in the off-season. Monitoring weekly loads and using ACWR can help you identify spikes in internal load.
The training load dashboard provides you with each individual's ACWR and uses colour-coding to highlight clients/athletes who are at higher risk.

The graphs highlight the % difference compared to the previous period for each metric to help you identify spikes in load week-to-week.

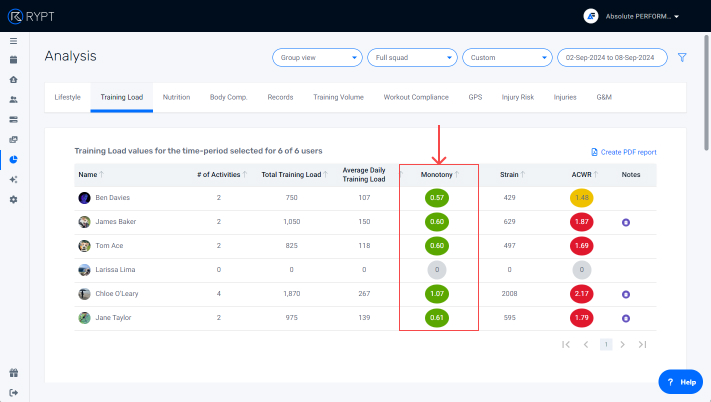
Make sure your sessions are varied enough
When training is too monotonous it can increase the risk of overtraining, illness, or injury when coupled with a high workload, or it can point to a lack of sufficient intensity when coupled with a low workload. It’s important that training is varied to trigger adaptations and allow sufficient recovery time. Internal load data can give insights into training monotony allowing coaches to adjust workloads as necessary.
The training load dashboard provides you with each individual's Monotony and uses colour-coding to highlight clients/athletes who are at higher risk.
The short video below gives you an overview of the Training Load Dashboard.
Video length: 1 min 47 secs