The GPS Dashboard Explained
The GPS Dahsboard is where you'll find the GPS data you have imported for your athletes, and also anydata they have submitted via the RYPT app with their activities. Like the other dashboards, the GPS dashboard is made up of a table that displays all of the different GPS metrics for the athletes and time period you selected, and charts to visualize the data.
Using the selectors at the top of the dashboard you can filter your data to create different reports.
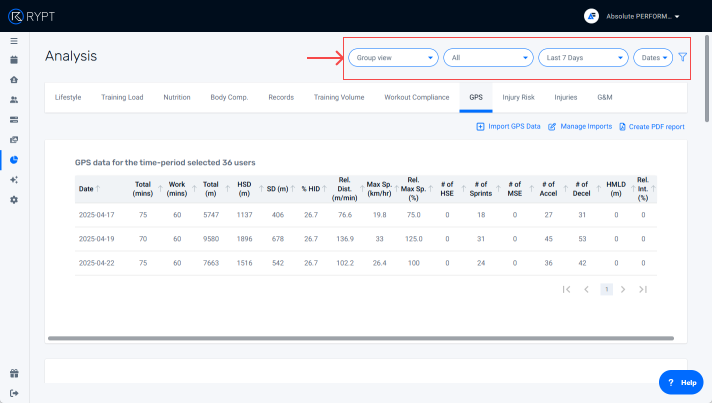
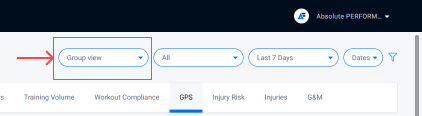
Creating Group Reports
You can generate a group report by select Group view and selecting the training group that you want to report on:
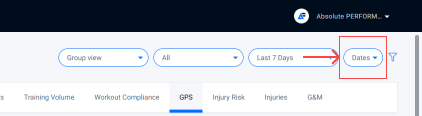
You can use the Dates/Users toggle to switch between two different reports:
Viewing session averages to ensure your session hit the targeted volume and intensity
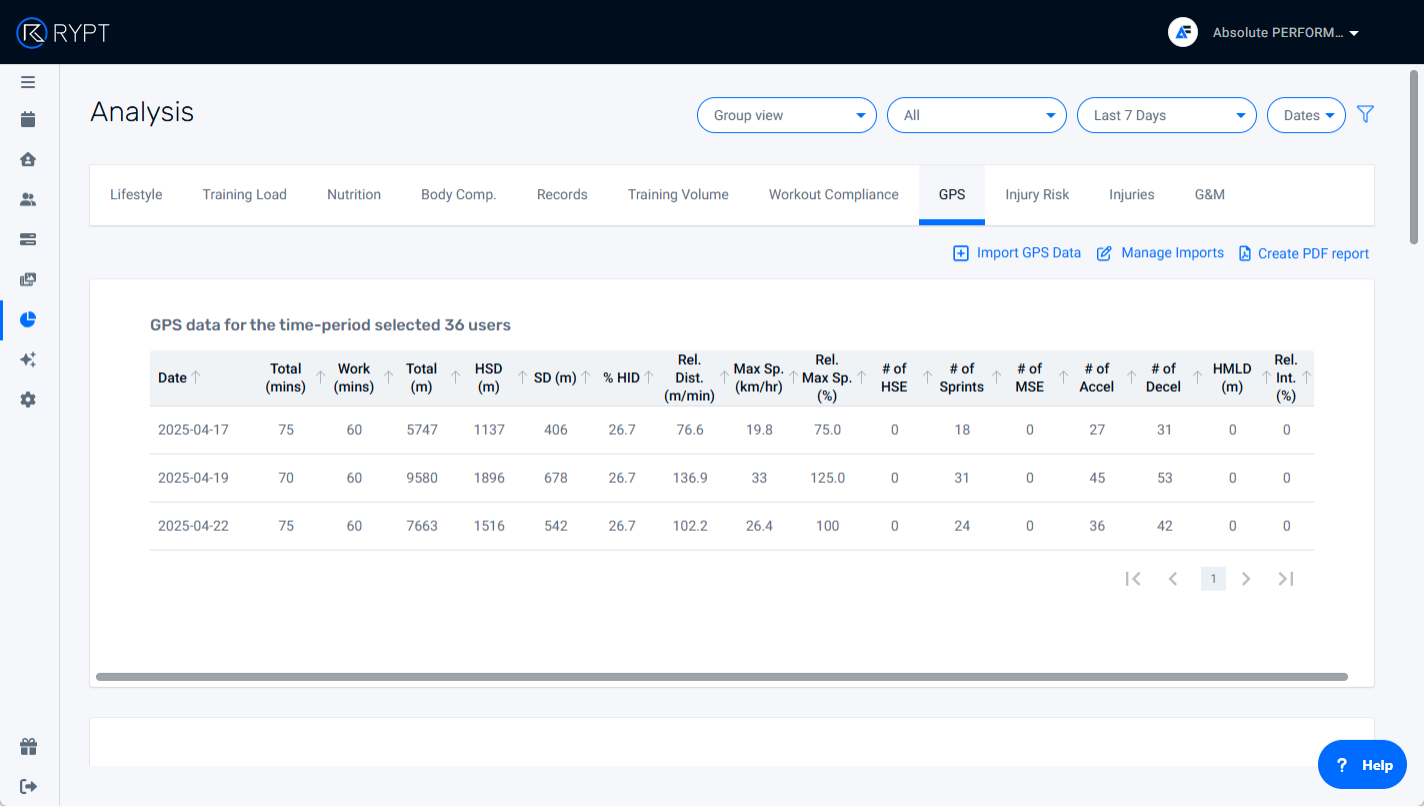
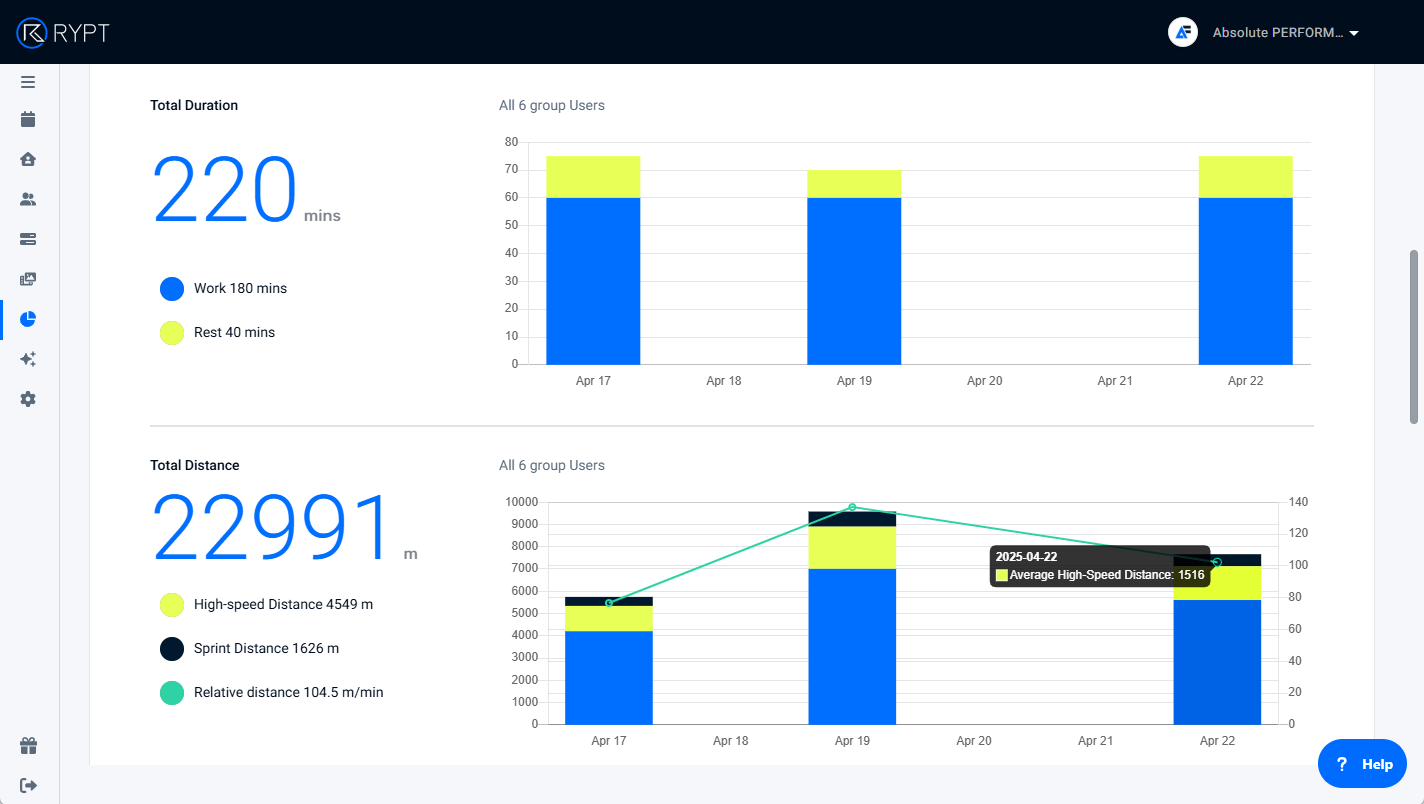
When Dates is selected, the dashboard will display the session averages for the group for each of the sessions in the selected time-period. By default, the data will include all activity types and only data from athletes who took full part in the session, but this can be changed using the additional filters as disussed below.
The data will be listed in the table and visualized on the charts. You can hover over the charts to show the details in a tooltip.
Viewing each athlete's total volume and comparing athletes
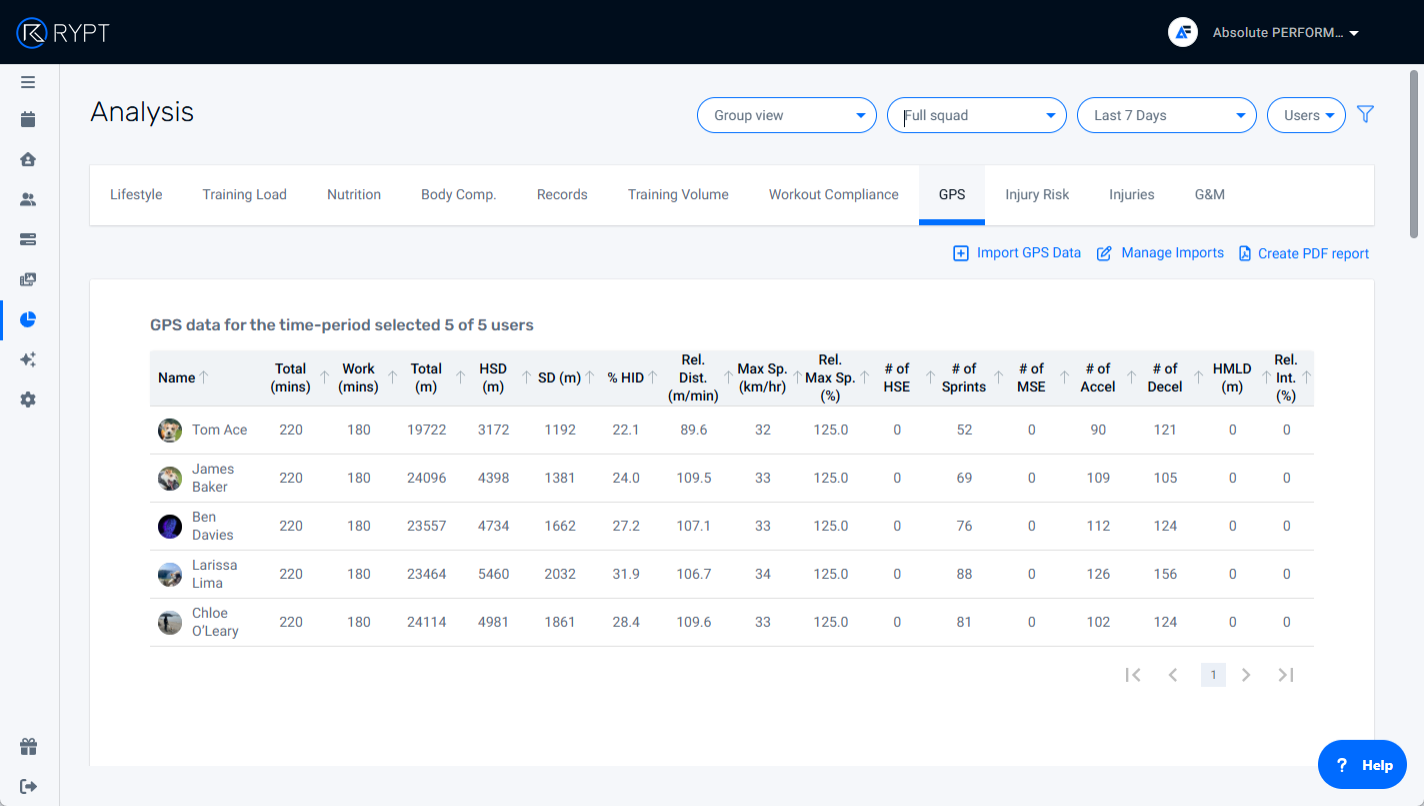
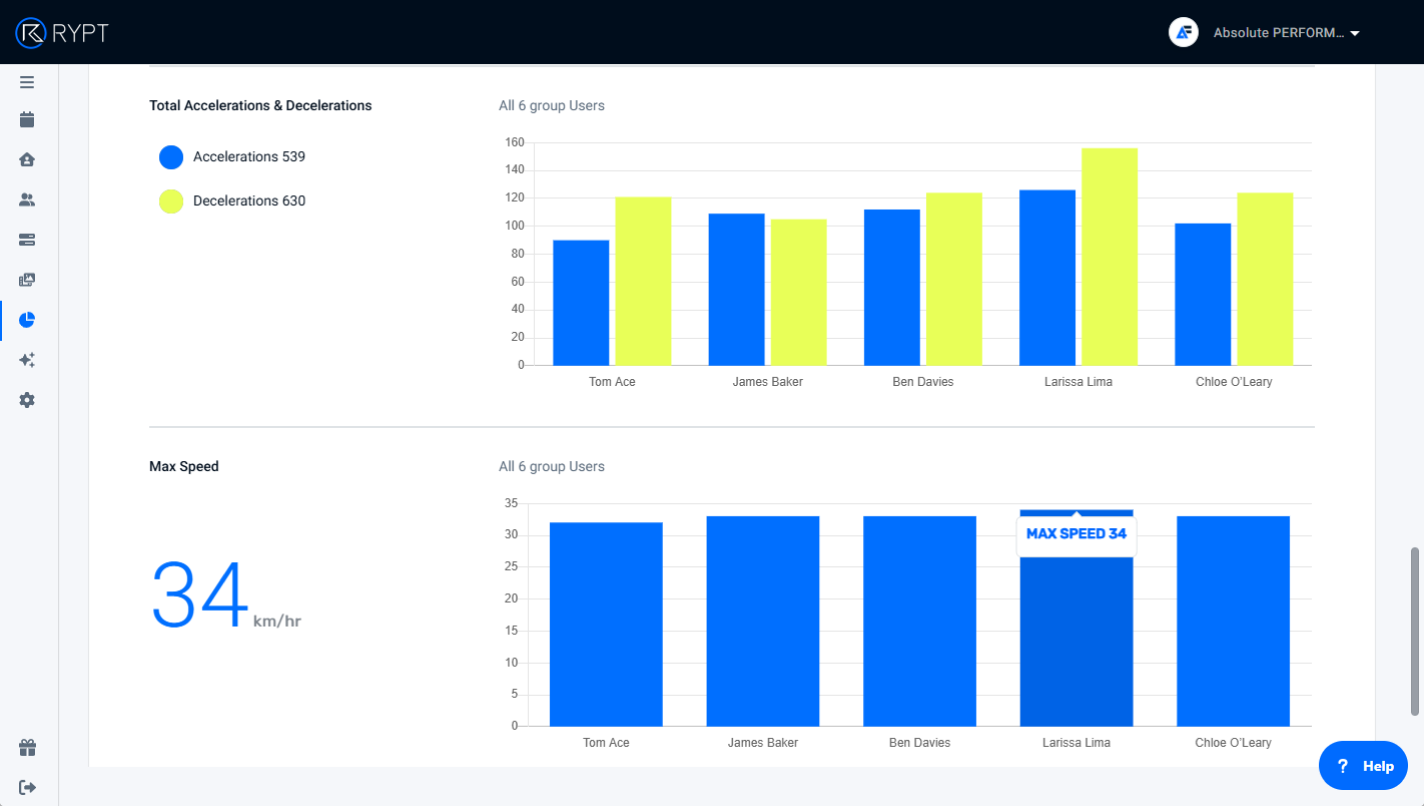
When Users is selected, the dashboard will display total volumes for the time-period for each of the athletes in the group. By default, the data will include all activity types and only data from athletes who took full part in the session, but this can be changed using the additional filters as disussed below.
Each athlete will be listed in the table and their data will be compared on the charts. You can hover over the charts to show the details in a tooltip.
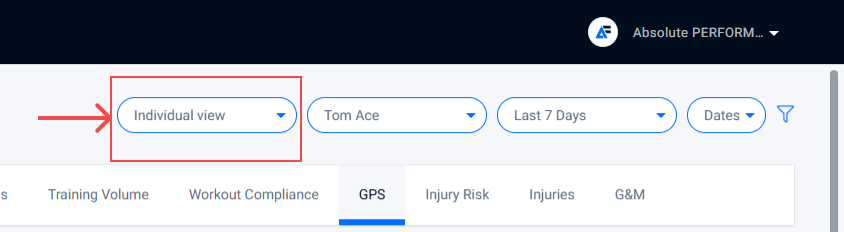
Creating Individual Reports
If you want to dig deeper into an individual athlete's data you can create an individual reort by selecting Individual view and selecting the athlete that you want to report on:
You can use the Dates/Users toggle to switch between two different reports:
Viewing an athlete's session data to ensure your session hit the targeted volume and intensity
When Dates is selected, the dashboard will display the data for each session in the selected time-period. By default, the data will include all activity types and only data for sessions that the athlete took full part in, but this can be changed using the additional filters as disussed below.
The data will be listed in the table and visualized on the charts. You can hover over the charts to show the details in a tooltip.
Viewing an athlete's total volume
When Users is selected, the dashboard will display total volumes for the time-period for the athlete. By default, the data will include all activity types and only data for sessions that the athlete took full part in, but this can be changed using the additional filters as disussed below.
The athlete's data will appear in the table and their data will be visualized on the charts. You can hover over the charts to show the details in a tooltip.
Using the Additional Filters
You can also apply different filters to your data to filter out certain data if you want to. This can be done by clicking the filter icon in the top right-hand corner as shown here:
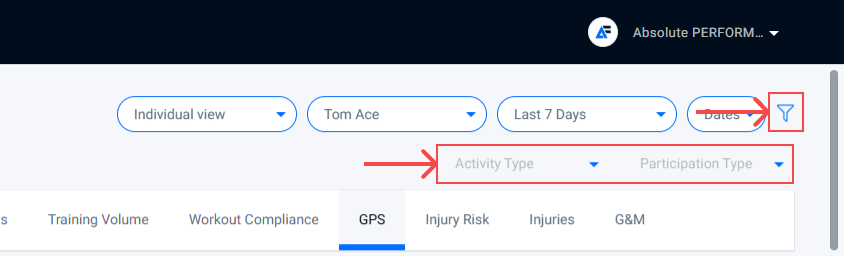
Here there are two filter options available:
- Participation / By default, only data for athletes that have taken full part in the session will be included in the dashboard ie. users with Participation set to Full. However, you can also choose to include users with other participation, including Injured/Ill, Return-to-Play, or Modified. Participation can be set for each athlete when you're importing your data.
- Activity Types / Each activity in RYPT has an Activity Type. These can be used to filter your GPS data, for example, if you only wanted to looked at data from your training sessions and not matches, the activity type can be used to exclude data from your matches from the report. The Activity Type for each session is set when you're importing your data.
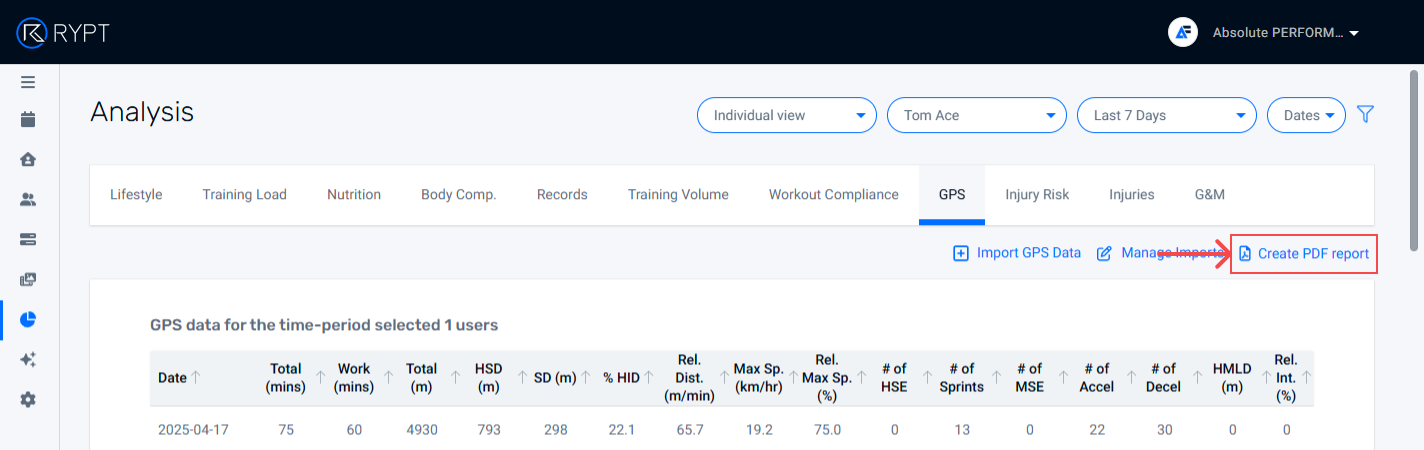
Creating PDF Reports
You can generate PDF reports of the GPS dashboard if you want to share any of the data with other coaches in your coaching team, or the athletes themselves. To create a PDF report, follow these steps:
- Select the data you want to report on in the dashboard ie. the training group or individual athlete, the time period, the report view, and any filters you want to add
- Click Create PDF Report at the top right-hand corner of the dashboard
- Choose what you'd like to include in the PDF report: Table, Graphs, or Table and Graphs
- Review your data and click Create report
You can see a video guide of how to create PDF reports here.