Monitoring Perceptual Readiness to Train/Compete
Perceptual Readiness Assessments provide further context around how your clients/athletes are coping with the load from their training program but also other stressors in their lives. They measure the athlete’s perceptual readiness to train/compete.
Monitoring readiness can help coaches determine whether they may need help with other aspects of their lifestyle that are affecting their performance and identify opportunities to make adjustments to an athlete’s training load to reduce the risk of illness or injury.
With RYPT, you can measure your clients'/athletes' perceptual readiness to train/compete with our well-being questionnaire. Well-being questionnaires are a simple, reliable, and validated method of monitoring athlete readiness by measuring the impact of lifestyle stressors on their training response, Saw et al. (2015), and readiness to train/compete, Gallo et al. (2015). They measure an athlete’s perceived well-being and can identify non-training stressors that are impacting an athlete’s recovery and performance.
RYPT's simple 6 questionnaire is based on the recommendations of Hooper, Mackinnon (1995), McLean et al., (2010), and Foster et al., (2013).
Capturing Data
Questionnaire
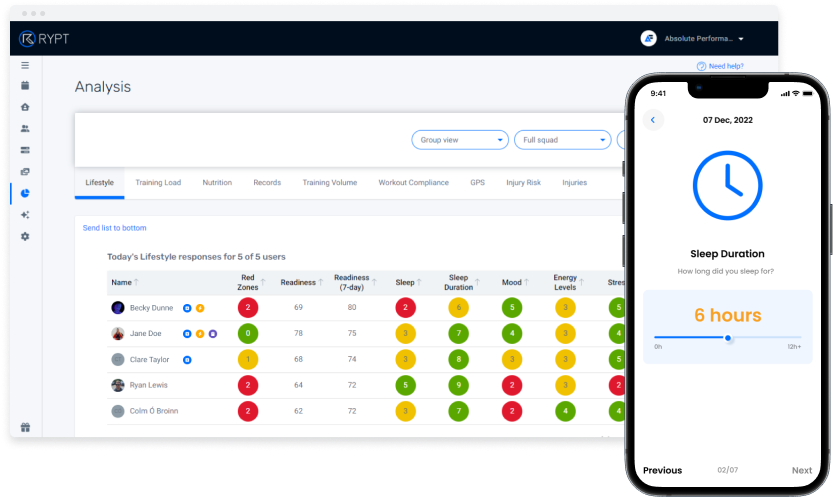
In the RYPT app, your clients/athletes have the option to complete a daily Lifestyle questionnaire. The questionnaire asks the client/athlete to rate their Sleep Quality, Sleep Duration, Mood, Energy, Stress, and Muscle Soreness, and from their responses, their Readiness score is calculated. They can also record notes if they'd like to flag anything or give you further context around their responses.
It's not compulsory that they complete the questionnaire every day and to make it easier for the client/athlete and improve compliance, some coaches may only ask that it be filled out on training and match/competition days. It's recommended that it is completed a minimum of 3 times per week to be able to track meaningful trends and identify meaningful changes in readiness that may impact injury risk.
This video gives you a quick demo of how simple it is for your clients/athletes to fill out the lifestyle questionnaire in the RYPT app.
Video length: 2 mins 03 secs
Sending Reminders
To improve compliance and engagement you can also send reminders from the calendar to clients/athletes who haven't completed their questionnaire.
Interpreting Data
Calendar
Flags to important data
Your day-to-day monitoring can be done from the calendar which will be populated with all of your clients'/athletes' data as they submit it. Flags in the calendar will highlight when someone has submitted red zones, questions answered 2 or below, or added notes with their questionnaire, so you quickly know where you may need to dig a little deeper. Identifying clients/athletes that you may need to have a conversation with around how they're feeling and adjust their program accordingly.
Lifestyle Dashboard
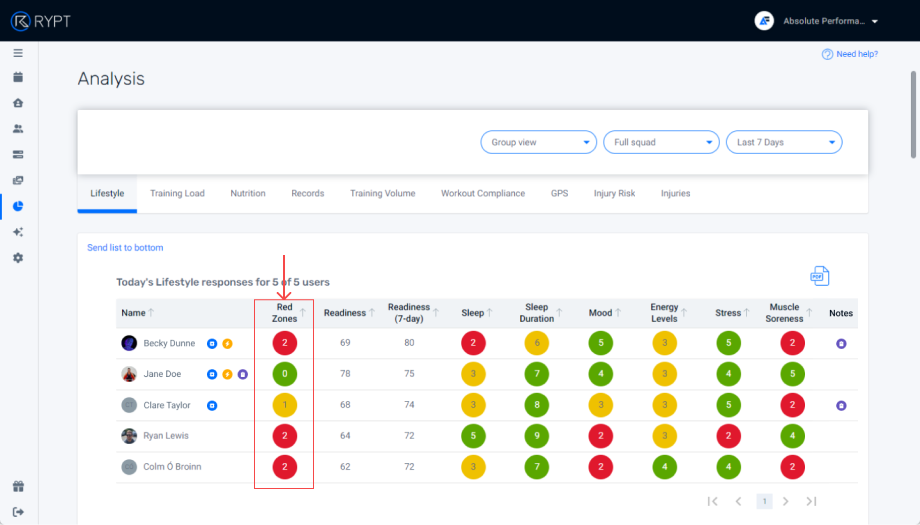
A deeper analysis of your well-being data can be done in the Lifestyle Dashboard in the Analysis section. Here you can you can analyze group averages or individual client/athlete data.
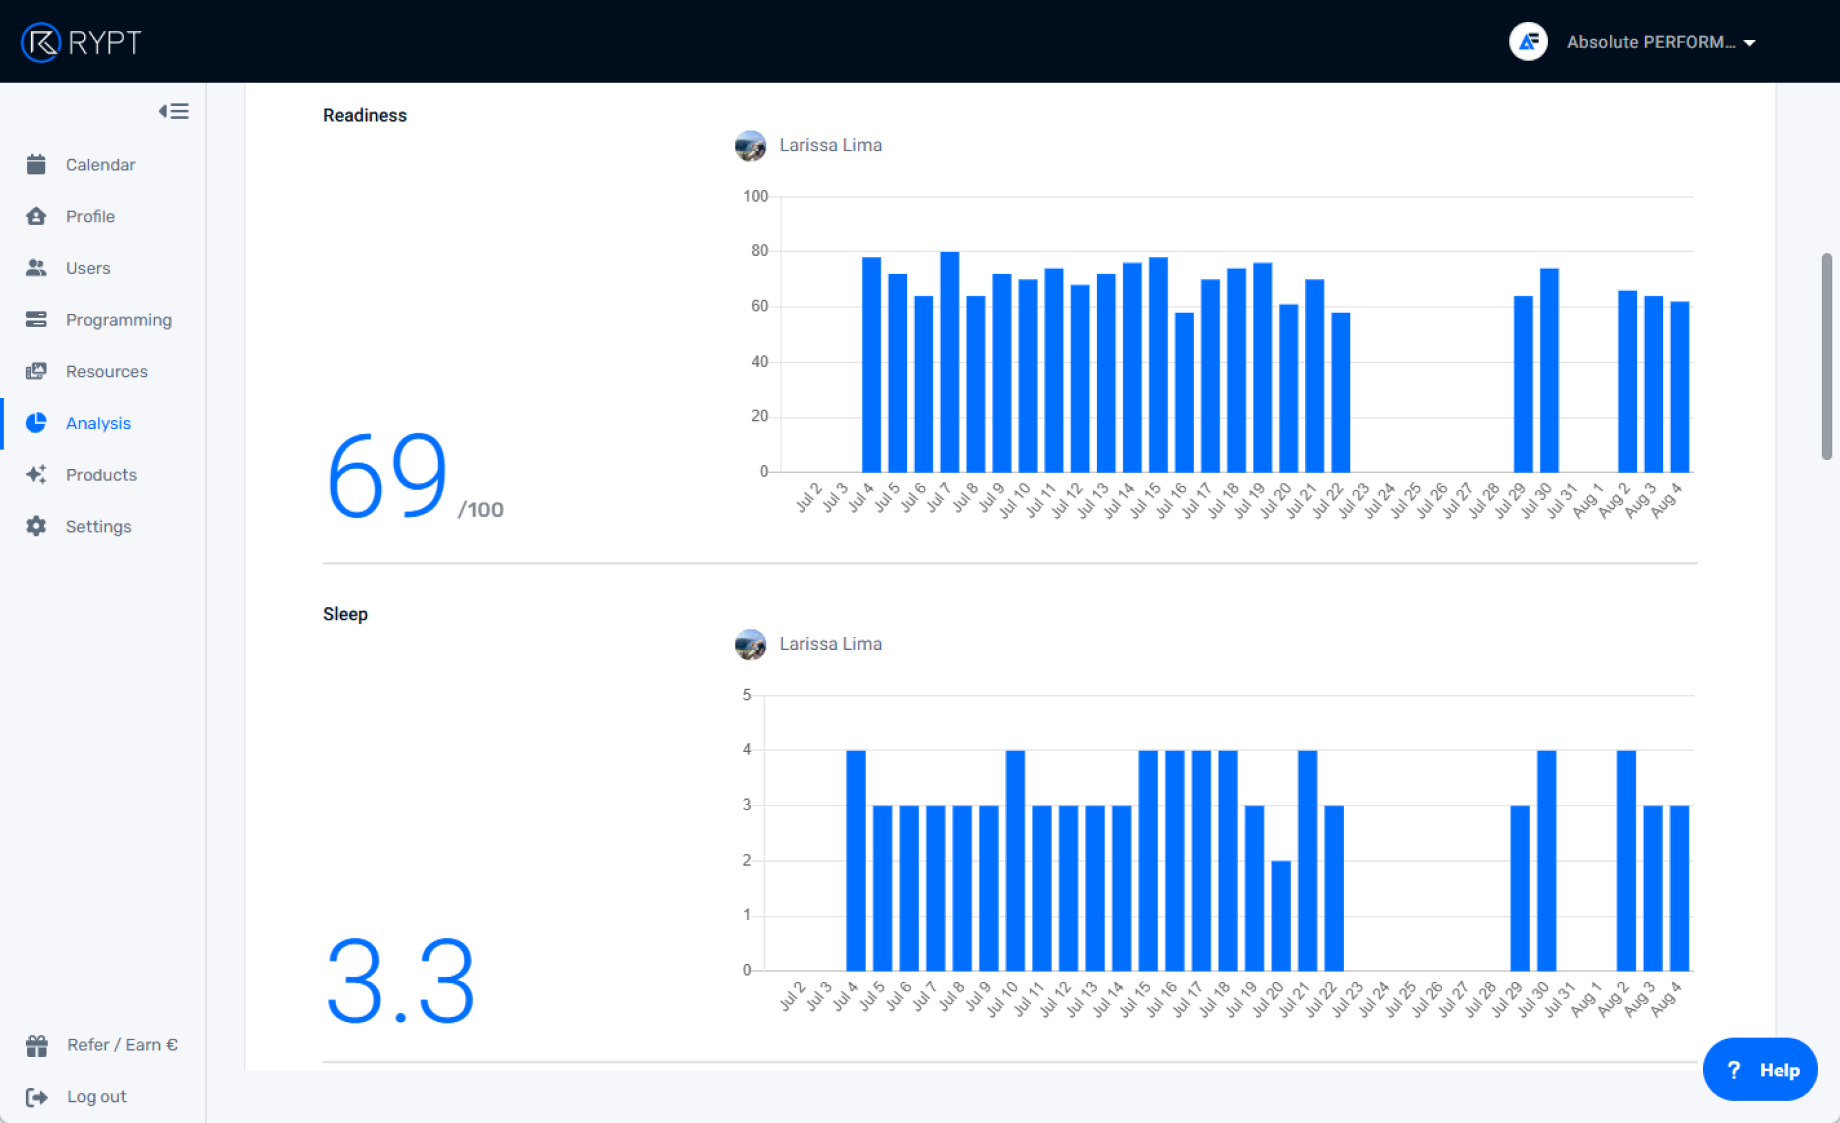
Track Daily Readiness and Compare with Last 7-days
Tracking daily Readiness can give you an insight into your clients'/athletes' perceptual readiness to train/compete on that day. This is a subjective measure so it can vary from athlete to athlete, therefore, it's also important to compare it with their 7-day average Readiness to identify whether there has been any drop-off.
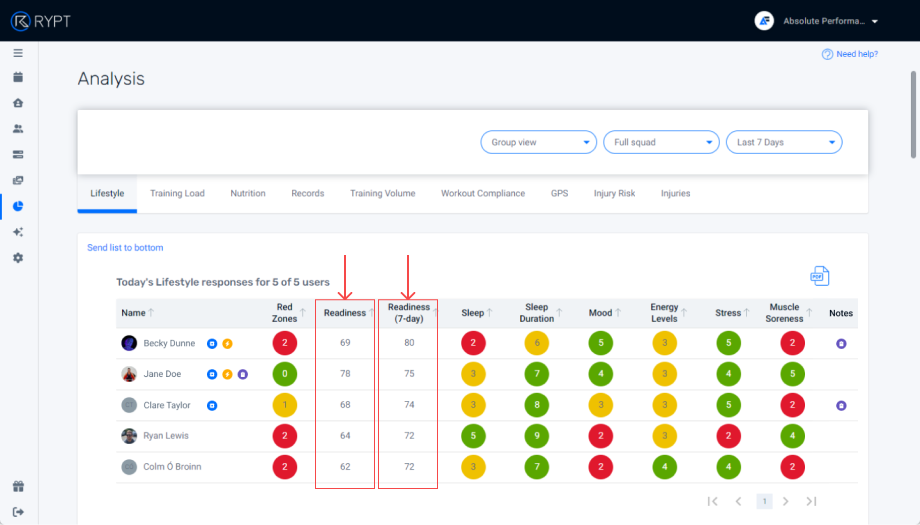
By selecting an individual client/athlete you can also view their data on charts and identify trends in their responses. This may identify specific areas affecting their performance and recovery that they may need additional help with.
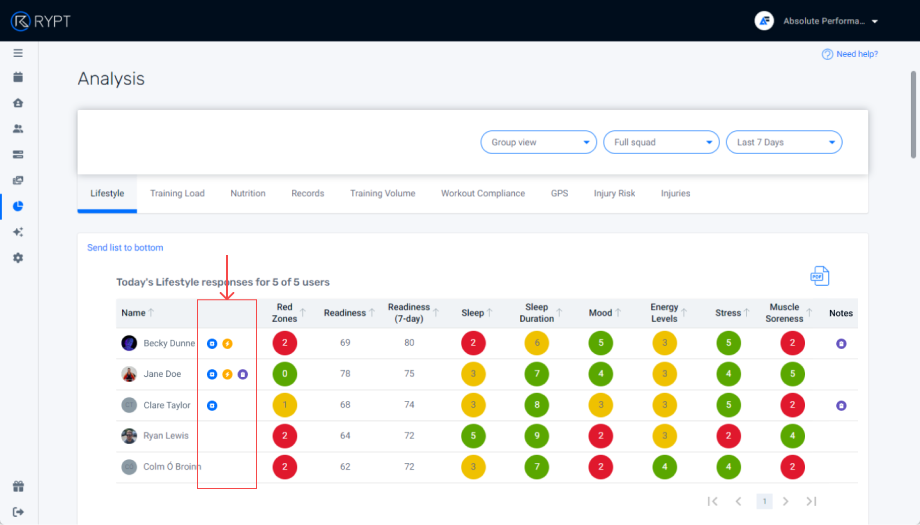
Identify Red Zones
Red zones are questions that the client/athlete has responded poorly on (2 or below). Red zones are flagged in the table as areas of particular interest as two or more red zones may indicate a potential drop-off in performance.
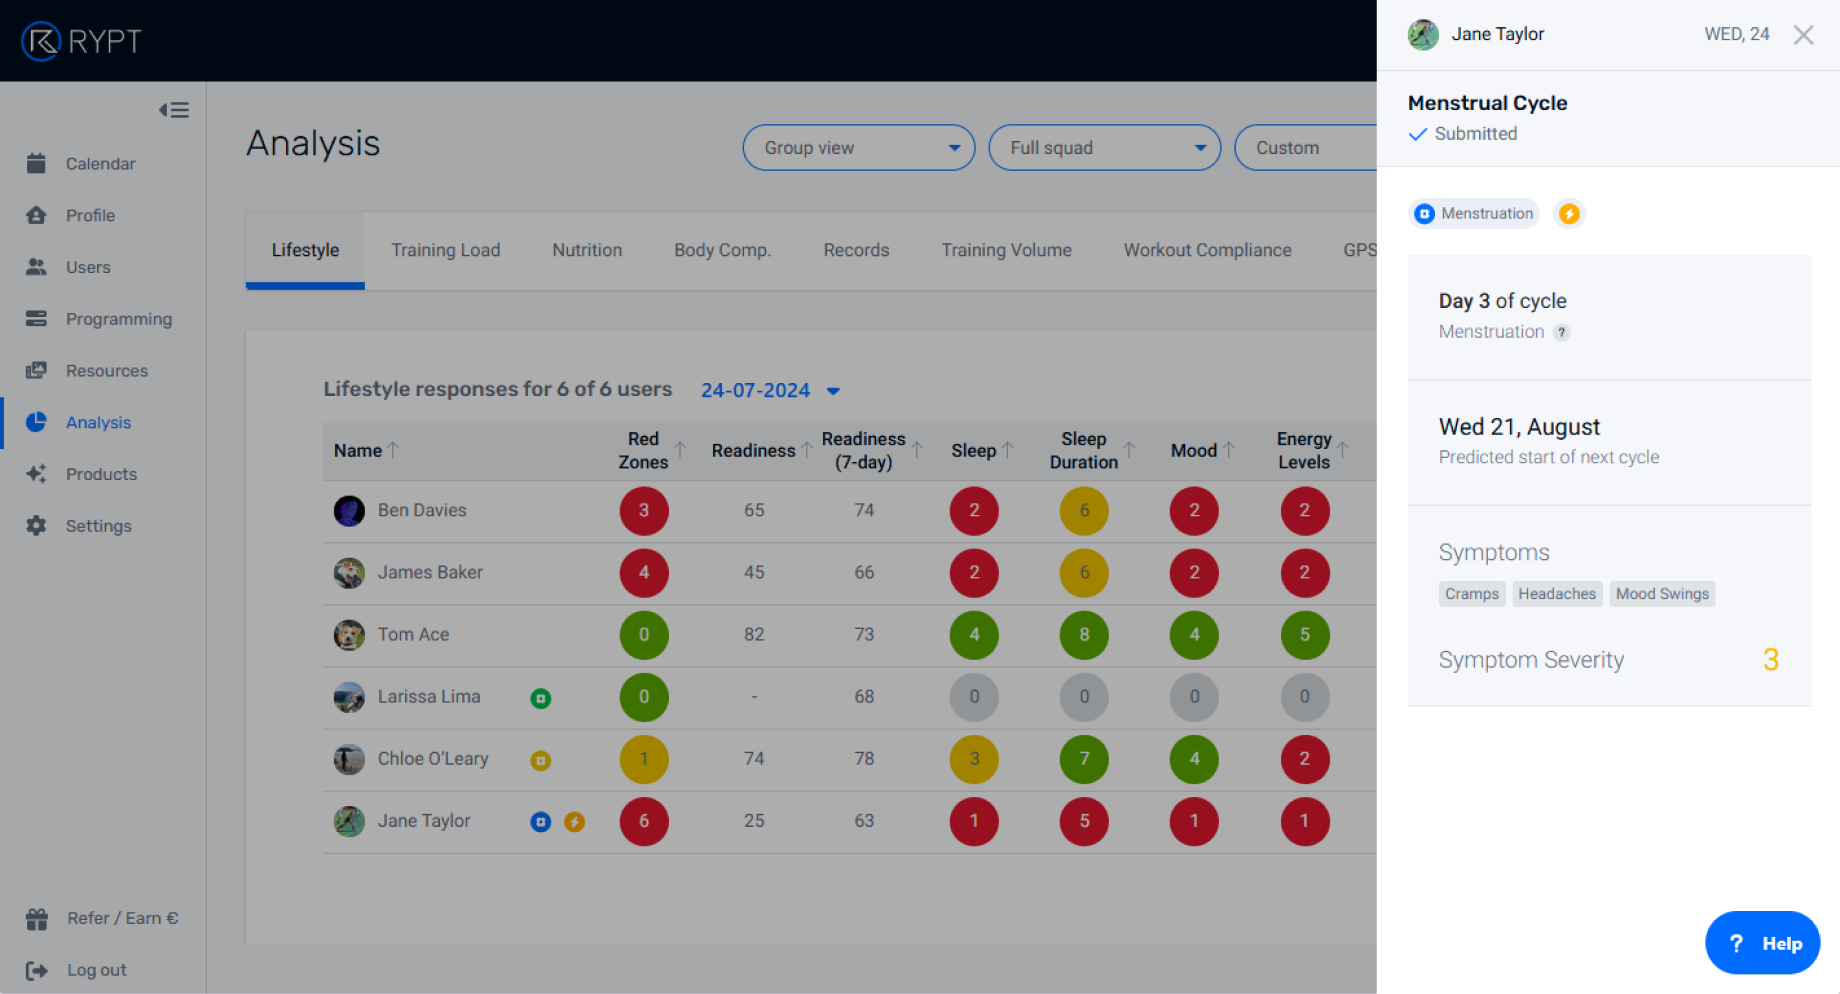
View Menstrual Cycle Data
For female athletes, menstrual cycle data is also displayed in the Lifestyle to give further context to their well-being questionnaire responses. At a glance you will see what phase of their cycle they are in and if they're suffering from symptoms which may impact their responses, and you can click on the icons to view their menstrual cycle questionnaire responses for that day in more detail.